Crucial’s P2 wasn’t much of a contender for the title of the Best SSD when it first launched, but now it’s firmly on our do not recommend list. Recently, Crucial decided to swap out the P2’s TLC flash with slower and less-endurant QLC flash, making the new P2 much worse than the original version. For instance, the QLC version of the drive is nearly four times slower at transferring files than the original, read speeds are half as fast in real-world tests, and sustained write speeds have dropped to USB 2.0-like levels of a mere 40 MBps. That’s slower than most hard drives. Unfortunately Crucial made the change without altering the product name or number or issuing an announcement. Crucial claims that the P2 will live up to its specs because the company baked the performance of QLC flash right into the spec sheet at launch. But those specs don’t match the performance you’ll see in numerous reviews of the originally-shipping drives, resulting in yet another misleading component swap from an SSD manufacturer.
Sound familiar? Just as Adata has been under fire for deceptive tactics, Crucial is now in the hot seat for doing the same. Unlike Adata, Crucial has kept the P2’s SSD controller the same, but swapping TLC flash for cheaper, slower, and less durable QLC can be even more detrimental to performance.
Changing components in any product can happen due to a variety of reasons, like to assure component supply or cut costs, but now even the more reputable SSD manufacturers are becoming more aggressive. While these companies say the modified SSD will meet or exceed the specs of the original, this is mainly true for only one portion of an SSD’s performance — the synthetically measured sequential performance of the SLC cache. That doesn’t reflect the true performance penalties that can occur during real-world use.
Depending on the modification to the initial design, the performance ramifications can be very deceiving if you don’t know what to look for. While the sequential read and write performance can be in line with the spec sheet, random performance and sustained write speeds can vary greatly and severely impact real-world performance. That’s bad news for new buyers on the hunt for their next storage upgrade, especially if they’ve read reviews with higher benchmarks of a drive with the same name that isn’t, well, the same drive they’ll purchase at retail.
In the case of Crucial’s P2, we typically don’t expect companies that make their own NAND to engage in this practice. However, Crucial did set a precedent last year when it released a second SKU of it’s BX500 when it swapped from TLC to QLC NAND. The issue this time around is that the company hasn’t changed the model number or branding at all. Instead, these new P2 SSDs secretly replace the original model we received for review.
Crucial says the P2 lives up to the P2’s specs because it accounted for lower QLC performance when it launched the drives. We did notice the abnormally low performance specs during our initial review: The drive consistently beat its spec’d performance, leading us to believe something was ‘off.’ The 500GB model was only rated to deliver write speeds of up to 940 MBps, which didn’t line up with what we saw in our testing as our sample managed to dish out writes of over 1.8 GBps.
This left us with an uneasy feeling when it came to the future of the P2, and now we know the reason. While these new QLC P2 variants may live up to the company’s spec sheets, just like we saw with Adata’s XPG SX8200 Pro, they most definitely do not live up to the original’s performance. Unfortunately that means the benchmarks you’ll see in every review of the original P2 SSDs paint a misleading picture that isn’t representative of the actual performance you’ll get with the drives.
A Closer Look

Externally, the two revisions of the SSD look nearly identical (original on top, replacement below). The packaging, label over the top of the drive, and even the PCB and component placement are mostly identical on our new sample. The only differentiator is that the new QLC variant has UK/CA printed on the packaging near the model number, and the new firmware revision. There are also two fewer NAND flash packages on our new sample, but that is well hidden under the drive’s label. The reduced number of chip packages comes because each package of QLC NAND stores more data, thus reducing the number of packages needed. That saves Crucial money.

As mentioned, the controller stays the same in both variants. Both utilize Phison’s E13T, a single-core, DRAM-less design optimized for cost-effectiveness and low power consumption. However, the original leveraged Micron’s TLC flash while the new one leverages Micron’s 1Tb 96L QLC (N28A) flash. The issues plaguing the P2 are multi-faceted, though; it’s not just the type of flash that is to blame for the performance issues we see with this new sample. It’s also tied to die density, how many dies are used, and, based on the new SSD’s S.M.A.R.T. data, possibly lowered power limits, too.
After some further digging with new SSD analysis tools we have on hand, we found that even our original sample doesn’t even have the 96L TLC that the company claimed it did. Instead of 512Gb 96L TLC as it should have been, our original sample came with the company’s 256Gb 64L TLC (B16A) flash. Presumably, this tactic was to use up the company’s last supplies of the flash before swapping to the 512Gb 96L flash it had started mass-producing at the time. This means there may be another variant of this drive in the wild that comes with performance that lands between these two, too.

These stats are important to note due to the influence that die density, die count, and interface speed directly have on an SSD’s performance. While leveraging higher density flash can help to reduce cost-per-GB and the number of components compared to drives built with less dense flash, it can also have a detrimental effect on performance.
SSD’s use algorithms that increase the interleaving of data for fast, responsive data access. Therefore, if an SSD controller can take advantage of more flash dies for greater interleaving capability, or faster interface speeds, higher performance can be attained. The inverse is also true, so fewer packages means slower performance.
Crucial’s new 500GB P2’s flash operates at similar interface speeds as the original (800 MTps), however, with only four dies that are four times the density (now 1Tb instead of 256Gb), the QLC-powered P2 can’t match the performance the original had with 16 total dies, especially in sustained write workloads.
MORE: Best SSDs
MORE: How We Test HDDs And SSDs
MORE: All SSD Content
Comparison Products
Today, we put Crucial’s new 500GB QLC-based P2 against its TLC-powered predecessor as well as a bunch of the best SSDs available. This comparison includes the Samsung 980 Pro, Sabrent Rocket NVMe 4.0, SK hynix Gold P31, Samsung 970 EVO Plus, Samsung 980, Seagate BarraCuda 510, and WD Blue SN550.
Game Scene Loading - Final Fantasy XIV
Final Fantasy XIV Shadowbringers is a free real-world game benchmark that easily and accurately compares game load times without the inaccuracy of using a stopwatch.

Game load performance is one of the only metrics in which the new variant has improved, but the difference is so minuscule we could blame newer, more optimized firmware or run-to-run variance as the reason for the TLC variant’s loss – we’re looking at a 0.05 second difference between the two drives.
In either case, both P2 variants trail the comparison pool with the slowest times by a large margin, making them both subpar for game loading.
Transfer Rates – DiskBench
We use the DiskBench storage benchmarking tool to test file transfer performance with a custom dataset. We copy a 50GB dataset including 31,227 files of various types, like pictures, PDFs, and videos to a new folder and then follow-up with a reading test of a newly-written 6.5GB zip file.
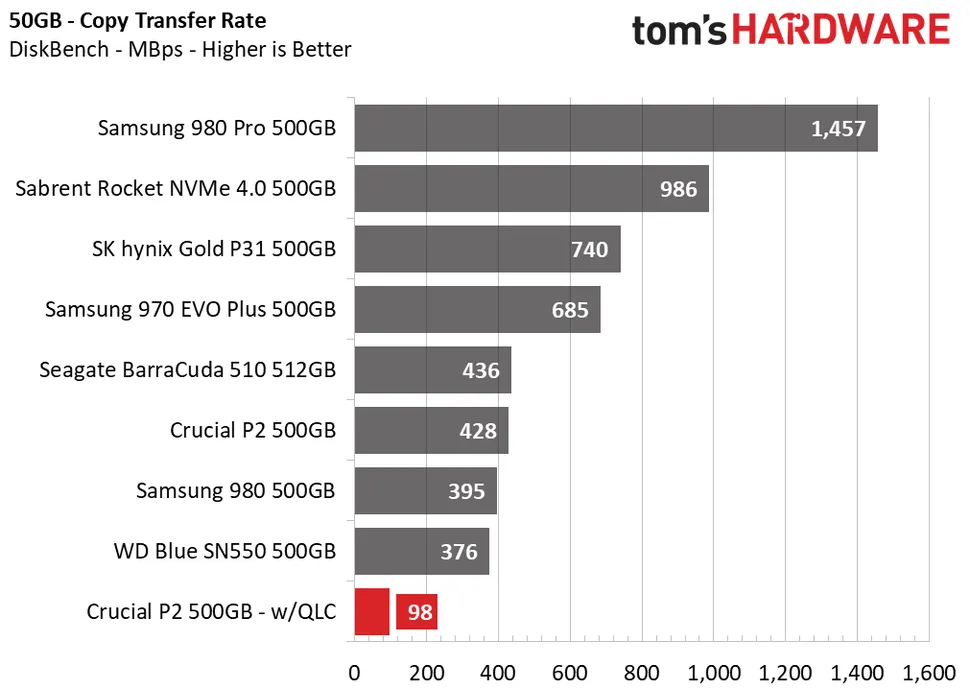

The QLC-based P2 delivered terrible performance during our real-world transfer test, which involves copying a 50GB file folder and reading back the test file. These are the types of real-world activities that are ubiquitous on PCs the world over, but you’ll take a significant performance haircut with the QLC P2.
The SSD could only muster up enough speed to copy the folder at a rate of 98 MBps, which is nearly four times slower than the original TLC-powered model. The drive also reads back large files at half the speed of the TLC variant, too.
Trace Testing – PCMark 10 Storage Test
PCMark 10 is a trace-based benchmark that uses a wide-ranging set of real-world traces from popular applications and everyday tasks to measure the performance of storage devices. The quick benchmark is more relatable to those who use their PCs for leisure or basic office work, while the full benchmark relates more to power users.


When tasked with light loads, the new QLC variant of the P2 delivers similar performance to its predecessor, scoring just a few points below in the Quick System Drive Benchmark.
However, when tasked with the Full System Drive Benchmark tests, the QLC variant fell flat with roughly 40% lower performance. Latency, the most important metric for an SSD, was also three to four times higher than any other competitor.
Synthetic Testing - ATTO / CrystalDiskMark
ATTO and CrystalDiskMark (CDM) are free and easy-to-use storage benchmarking tools that SSD vendors commonly use to assign performance specifications to their products. Both of these tools give us insight into how each device handles different file sizes.


Based on the ATTO benchmark alone, it looks like the P2 should perform better than its predecessor, but unfortunately, this didn’t carry over into other tests because ATTO tests with fully compressible data, which is mostly unrealistic. Crystal Disk Mark’s results, on the other hand, show the new P2 delivers slower sequential performance with incompressible data, which more closely aligns with the data most people store on their PC.
Additionally, the QLC-powered P2’s random performance at a queue depth of 1 (QD1) remains close to the TLC variant, but the QLC model severely lags at higher queue depths, delivering one-third to half the speed.
Sustained Write Performance and Cache Recovery
Official write specifications are only part of the performance picture. Most SSDs implement a write cache, which is a fast area of (usually) pseudo-SLC programmed flash that absorbs incoming data. Sustained write speeds can suffer tremendously once the workload spills outside of the cache and into the "native" TLC or QLC flash. We use iometer to hammer the SSD with sequential writes for 15 minutes to measure both the size of the write cache and performance after the cache is saturated. We also monitor cache recovery via multiple idle rounds.
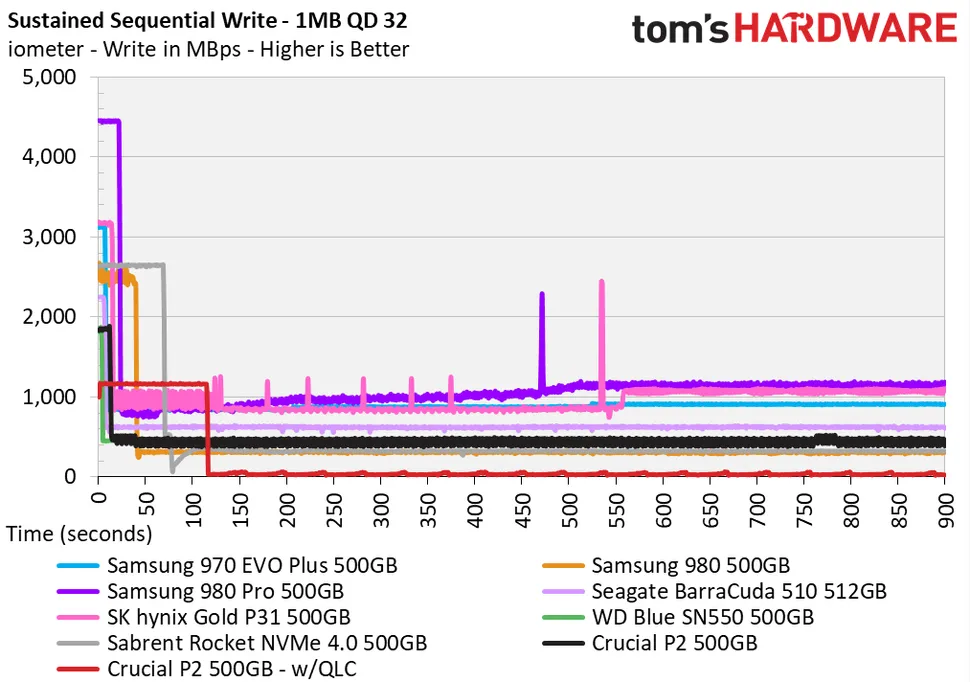


One improvement, at least to some degree, is the increased SLC cache capacity. The TLC variant’s SLC cache measured only 24GB, while the QLC replacement’s cache measured roughly 135 GB. Still, while the capacity has increased in an attempt to offset the impact of the much slower QLC flash, the speed of the P2 degraded severely both within and outside of the SLC cache. Some of this goes back to the reduced number of packages, which hampers interleaving, and thus parallelism.
Our TLC-based P2 wrote at roughly 1.85 GBps while the QLC-based P2 wrote at 1.16 GBps before degrading. Once degraded, the TLC variant's sustained write speeds measured roughly 450 MBps, which isn’t great, but acceptable. However, the QLC variant averaged USB 2.0-like speeds of just 40 MBps after the SLC cache was full.
Power Consumption
We use the Quarch HD Programmable Power Module to gain a deeper understanding of power characteristics. Idle power consumption is an important aspect to consider, especially if you're looking for a laptop upgrade. Some SSDs can consume watts of power at idle while better-suited ones sip just milliwatts. Average workload power consumption and max consumption are two other aspects of power consumption, but performance-per-watt is more important. A drive might consume more power during any given workload, but accomplishing a task faster allows the drive to drop into an idle state more quickly, ultimately saving energy.


Not only did the P2’s performance go down the drain, but so did power efficiency. While the average power consumption dropped during our 50GB file test in comparison to its predecessor, the new QLC-based P2 scores the lowest efficiency out of the test pool.
Test Bench and Testing Notes

| CPU | Intel Core i9-11900K |
| Motherboard | ASRock Z590 Taichi |
| Memory | 2x8GB Kingston HyperX Predator DDR4 5333 |
| Graphics | Intel UHD Graphics 750 |
| CPU Cooling | Alphacool Eissturm Hurricane Copper 45 3x140mm |
| Case | Streacom BC1 Open Benchtable |
| Power Supply | Corsair SF750 Platinum |
| OS Storage | WD_Black SN850 2TB |
| Operating System | Windows 10 Pro 64-bit 20H2 |
We use a Rocket Lake platform with most background applications such as indexing, windows updates, and anti-virus disabled in the OS to reduce run-to-run variability. Each SSD is prefilled to 50% capacity and tested as a secondary device. Unless noted, we use active cooling for all SSDs.
Bottom Line

Crucial’s planned component changes may have been part of a strategic plan to more efficiently utilize its resources in its products, probably to both save money and to assure supply, but the manner of execution is important. Unfortunately, this business tactic has resulted in truly abysmal performance compared to the original model, thus drastically reducing the value proposition of buying the P2.
You wouldn’t know that, though, if you hadn’t read this article: Every review that you see of the P2 has higher performance values than what you’ll see with the new models. There’s no way to tell which drive is which, so it’s best to assume that all P2 SSDs on the market come with QLC flash now, and the Crucial P2 won’t live up to its billing in the numerous product reviews you’ll find on the internet.
We no longer recommend Crucial’s P2 for those seeking a value-level SSD. Rather, we would go as far as to place it on our ‘do not buy’ list.
While component changes can be deemed acceptable in certain circumstances, they require proper disclosure and shouldn’t come after reviews of the same device show it has much better performance than the ‘new’ version. In those cases, the company should issue a new model number.
The new P2 offers nowhere near the same level of performance as its predecessor in most situations, and it already severely lagged the competition in the areas that remain unchanged. For those considering the P2, please steer clear and opt for one of our Best SSD recommendations instead.
MORE: Best SSDs
MORE: How We Test HDDs And SSDs
MORE: All SSD Content
You may be interested in:
>> Is a Chromebook worth replacing a Windows laptop?
>> Find out in detail the outstanding features of Google Pixel 4a
>> Top 7 best earbuds you should not miss
Related Posts:
>> Recognizing 12 Basic Body Shapes To Choose Better Clothes
>>Ranking the 10 most used smart technology devices
>> Top 5+ Best E-readers: Compact & Convenient Pen

0 Comments:
Post a Comment